

Does it meet the SDV Guarantee?
Synthetic data that is generated from any SDV Synthesizer comes with an “SDV Guarantee” that covers several important structural elements like adhering to the correct ranges, following known business rules, and containing referential integrity between primary/foreign keys. These checks are fully encapsulated in the Diagnostic Report which is available through SDV. As the first step to troubleshooting, we recommend running the Diagnostic Report to evaluate whether your synthetic data meets this SDV Guarantee. To run the report, pass in the real data that you’ve used for training your synthesizer, the synthetic data that the synthesizer produced, the metadata, and any known business rules in the form of constraints.When the guarantee is not met
If the guarantee is not met, meaning that the score is less than 100%, something may be going wrong in your synthetic data generation or you may have uncovered a bug in SDV. We recommend the following troubleshooting steps: Check your own pre- and post-processing scripts. Are you maintaining your own pre- and post-processing script outside the context of SDV? The SDV Guarantee is meant to cover the data that is directly passed into SDV’s synthesizer and the synthetic data that the synthesizer directly outputs. Running the diagnostic report again on the direct input/output to SDV yields more accurate results and may help you pinpoint whether there may be a bug in your pre or post-processing script. How are you loading in the data? SDV Synthesizers are designed to work best with data that is loaded via SDV’s importing functions. For example, the CSVHandler for importing CSV data or an AI Connector for importing from a database. You can also use the default pandas read functionalities to read in your data. But please do not apply any special data type conversions beyond what the features provide to you! This may mess up the formats that SDV expects to learn. Use the Diagnostic Report to pinpoint the problem areas. The Diagnostic Report provides a composite score that includes several sub-components for Data Structure, Data Validity, Constraint Validity, and Relationship Validity. Use the Diagnostic Report API to get a detailed breakdown into the exact properties, columns, and tables that are causing problems.When the score is 100%
If the Diagnostic Report’s score is 100%, the SDV Guarantee is met. This means that from SDV’s perspective, the synthetic data is valid. So the next question for troubleshooting is: Does SDV have the correct information to determine validity? We recommend taking the following steps: Inspect the metadata for accuracy. SDV treats the metadata that you pass in as the ground truth to determine what counts as valid synthetic data. It’s worth inspecting this metadata if any of the data columns or relationships don’t make sense. If you’re noticing incorrect formatting, invalid values, or unexpected values in any of the columns, pay attention to the sdtypes that are associated with each of the columns. Marking a discrete column as “numerical” or an unrelated concept as the wrong sdtype can cause issues in both synthetic data creation and evaluation.- Setting pii as False in the metadata will allow SDV to re-use the same values it sees in the training data, making the data more realistic. Use this only if the original data does not represent personal identifiable information.
- For PII data, you can also adjust the pre-processing applied to these columns to yield better results. There are a number of transformers that you can choose from to adjust the realism of the data.
Improving the statistical quality
The statistical quality of the synthetic data refers to the aggregate pattern that all the data points exhibit, such as the overall distributions and correlations. To begin your investigations, we recommend running the Quality Report. This report compares the real and synthetic data across a variety of statistical measures including marginal distributions, pairwise correlations, cross-table correlations, and cardinality. Even if you expect more complex patterns in your dataset, we often find that starting with marginal distributions and pairwise correlations is insightful and can be indicative of other quality issues in your data. To run the report, pass in the real data used for training your synthesizer, synthetic data created from the synthesizer, and metadata.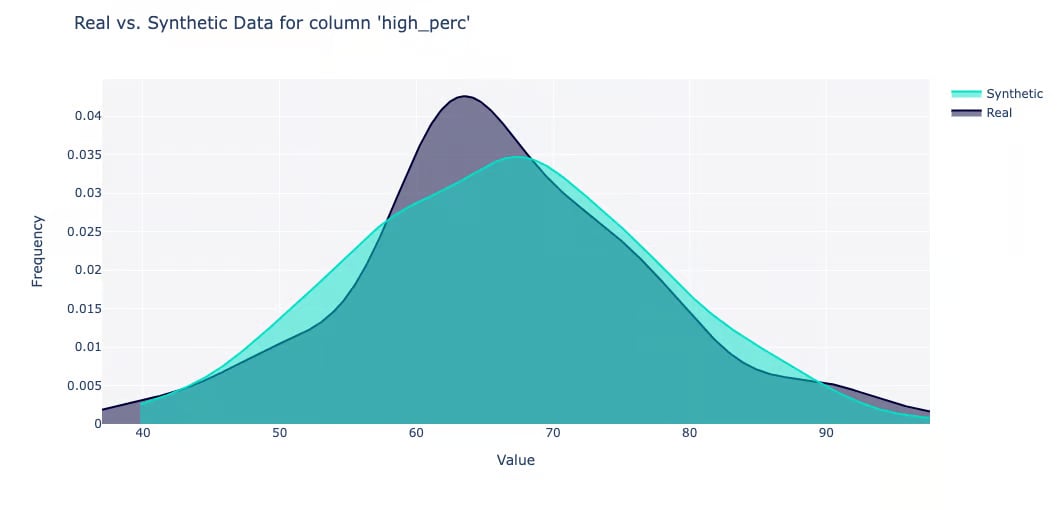
The optimization framework
Based on the results, there may be several areas that you’d like to further optimize. A natural question to ask at this stage is: What quality shore should I aim to achieve? 90%? 95%? The answer is that it depends on what you’re trying to achieve. Optimizing the synthetic data quality can end up becoming a vague and long-standing task if the objectives are not clearly defined. We recommend adopting an optimization framework that is based on the intended downstream usage of the synthetic data. For example, if your goal is to use the synthetic data downstream for performance testing, your objectives would be for (a) the synthetic data to run successfully in the downstream pipeline, and (b) the results achieving some degree of similarity with respect to real data. This is a more tangible outcome that allows you to set your expectations. The exact statistical quality score (whether it’s 80% or 99%) is, at best, a proxy for the ultimate ROI you expect to achieve with synthetic data. Our recommendation: Always run the synthetic data for the downstream task, and optimize until the downstream task is successful. In the rest of this section, we’ll go through some areas for improving the statistical quality in order of what we’ve observed to make the most to least impact. Following each suggestion, please remember to re-fit your synthesizer and re-sample synthetic data in order for the changes to take effect.Improving individual marginal distributions
The marginal distribution, aka the shape of individual data columns, often has the most impact on downstream usage. Luckily, SDV offers a number of features that make this easy to adjust. The most common failure mode for marginal distributions is when the synthetic data appears smoother and rounder than the real training data. This happens because most synthesizers (and in general most AI/ML models) are built with an assumption of having normal data, aka a smooth bell curve. When used out-of-the-box this can have the effect of smoothing out any skews, spikes, modes, or non-standard characteristics of the data. There are a few options for improving the realism in this case, assuming that you are using the HSA Synthesizer:- Add a preset for individual column distributions. In the default HSA configuration, each individual table is ultimately modeled using a GaussianCopula, which allows you to set individual column shapes for numerical variables. For more information, see HSA’s settings, and the underlying settings for GaussianCopula.
- Set the XGCSynthesizer for particularly challenging tables. The XGCSynthesizer offers vastly more choices in marginal distributions.
- Update the pre-processing of individual columns. Your marginal distributions may also improve if you update the column-level pre-processing that SDV applies by default. For more information, see the docs for updating transformers as well as the glossary of transformers based on the sdtype. We especially recommend experimenting with the LogScaler (for data exhibiting logarithmic properties) and the ECDFNormalizer (which can brute-force non-standard, empirical distributions).
Improving column correlations
In some cases, your marginal distributions might look ok but the issue might be in the correlations between different columns in a table. By default, we’ve observed that HSA can capture linear and monotonic correlations between two continuous variables right out-of-the-box. But there are two key failure modes that it may be susceptible to:- Correlations between discrete variables might not be captured well. This applies to associations between two discrete columns, as well as patterns between a discrete column and categorical column.
- Non-linear and non-monotic correlations might not be captured well between continuous variables, for example if a column X and column Y form a “U” or “O” shape. (While you may encounter such patterns appearing in academic datasets, we find this case to be relatively rare in real enterprise datasets.)